PayPal
PayPal is a financial technology company operating a suite of different products with the mission to democratize financial services across all strata of society. Please note this project talks more about my process rather than the actual output itself. The information on images are placeholders.
Product Management, E2E Feature Launch
Intern
Company
Year
PayPal
2023
Role
Project
Overview
In the expansive digital landscape of PayPal, data-driven actions are imperative for the smooth functioning of different operational segments. Within my organization, there came this quintessential challenge of seamlessly integrating 11 distinct programs, each encapsulating a vast array of reports, to serve a diverse range of internal stakeholders. This wasn’t only about navigation, but more about creating a holistic user-centric ecosystem, ensuring efficient access while upholding clarity and consistency. Furthermore, it was also about defining metrics for success, socialization, and communication.
Portals - Transforming data accessibility and interdepartmental synergy
Design
The Double Diamond
Discover: This is the exploration phase. It is analogous to brainstorming on a whiteboard where user needs, pain points, and project challenges are identified through research, engagements, and interviews. It includes a thorough understanding of the user journey.
Define: In this stage, insights from the discovery phase are segmented and prioritized. The highlight of the phase here is to synthesize the information, categorize it, and define clear, actionable objectives.
Develop: This is the stage where solutions are conceived and iterated upon. The product starts to take shape and aligns closely with user needs and project goals.
Deliver: The final stage where the product comes to life. It is implemented, socialized, and monitored through a system of feedback, continuous iterations, and metric capture.
The Double Diamond is a four-staged design approach that is widely used because it somehow manages to be structured and flexible at the same time. Given the wide scope of this problem, I decided to use this framework when it came to developing this product.

Double Diamond process for this project
Discover
Understand Pain Points
Before diving into any solutions, I started my process by understanding the genuine challenges and needs of the users. Given that the initial scope was large, delving further into the user journey would help define the scope a little better and give a clearer understanding of the problem. After several conversations and simulating the experience myself, I cataloged a series of pain points across the diverse audience spectrum.
Difficulty Navigating Multiple Programs: Across all reporting layers, there were around 100 reports storing data on 11 separate programs. Within each report were several different tabs which led to the actual number of dashboards being closer to 300. Users often found themselves lost, unable to smoothly transition between different reports.
Inconsistent UI Elements: There was this inconsistency across reports and the experience put forward by different programs. For users who are concerned with digesting data across multiple programs, this inconsistency added to cognitive load and reduced efficiency.
Dynamic Report Landscape: The nature of reporting is such that it is continuously evolving. Sometimes, new reports are introduced to tackle new requirements and other times, old reports are upgraded to align more closely with business needs. However, tracking different versions of reports and trying to keep updated with this changing landscape presented it’s own set of problems. To the creators, they had to socialize and update each time they made a modification. To the viewers, they had to dig deep and find the latest version of reports. This tracking process can often lead to people spending more time trying to locate something rather than actually utilizing it.
Ambiguity in Access Rights: A recurring concern was about access rights. Users were unsure about which reports they could view, what permissions they needed to gain access to reports, and what the process was to gain said access. From a report creator’s perspective, they want to streamline the process so they don’t need to deal with incorrect requests.
Define
Segment and Prioritize
After understanding the basic pain points, the next step was trying to categorize the users according to their pain points. While conducting user research, I came to realize that this was essentially a two-sided product comprising Creators - people who develop reports for various programs - and Users - people needing to access reports for different programs,
In order to prioritize the different pain points, I created a prioritization matrix (not shown here) where I evaluated each point on three factors - whether it will help both user groups, the impact it would have on each group, and the ease of integrating this with the overall vision
Creator Pain Points
1. Dynamic Report Landscape:
Upgrading Needs: Continuous adaptation to ever-changing business requirements, necessitating updates or new reports.
Effortful Distribution: The task of notifying relevant stakeholders about every update or change, resulting in extensive overhead.
2. Ambiguity in Access Rights:
Process Inefficiencies: Frequent need to manage access, often on a case-by-case basis.
Decision-making Load: Absence of a clear structure for granting permissions.
User Pain Points
1. Navigation Challenges:
Volume Overwhelm: Navigating 300 dashboards across programs without clear structure.
2. UI Inconsistencies:
Varied Interfaces: Each program or report having a distinct look, leading to confusion.
3. Report Evolution Difficulties:
Keeping Up: Struggling to locate the most recent versions of reports.
4. Unclear Access Protocols:
Permission Ambiguity: Absence of a streamlined process for acquiring permissions.
Develop
List Solutions and Build
Multifaceted Audience Catering: The system needed to serve a vast range of users: from customer service representatives at the grassroots to decision-making executives at the helm, each coming with varied tech proficiency and objectives.
Unified Yet Distinct: Although the programs were diverse, there was a pressing need for a consistent look and feel. This uniformity would ensure users felt familiar and comfortable, irrespective of the program they accessed.
Adaptable Reporting Structure: With an ever-evolving landscape of reports and the vast number within each program, the navigation system had to be flexible, allowing for the easy addition or removal of pages.
Robust Access Control: Given the sensitivity of some data, implementing a clear, secure, and easily understandable permission structure was paramount. Users had to know what they could access and why, with troubleshooting capabilities for any access-related queries.
After identifying the pain points, I decided to go ahead and list solutions that the product should have. These were eventually consolidated as design requirements and the objectives to keep in mind while going through the design process.
Typography
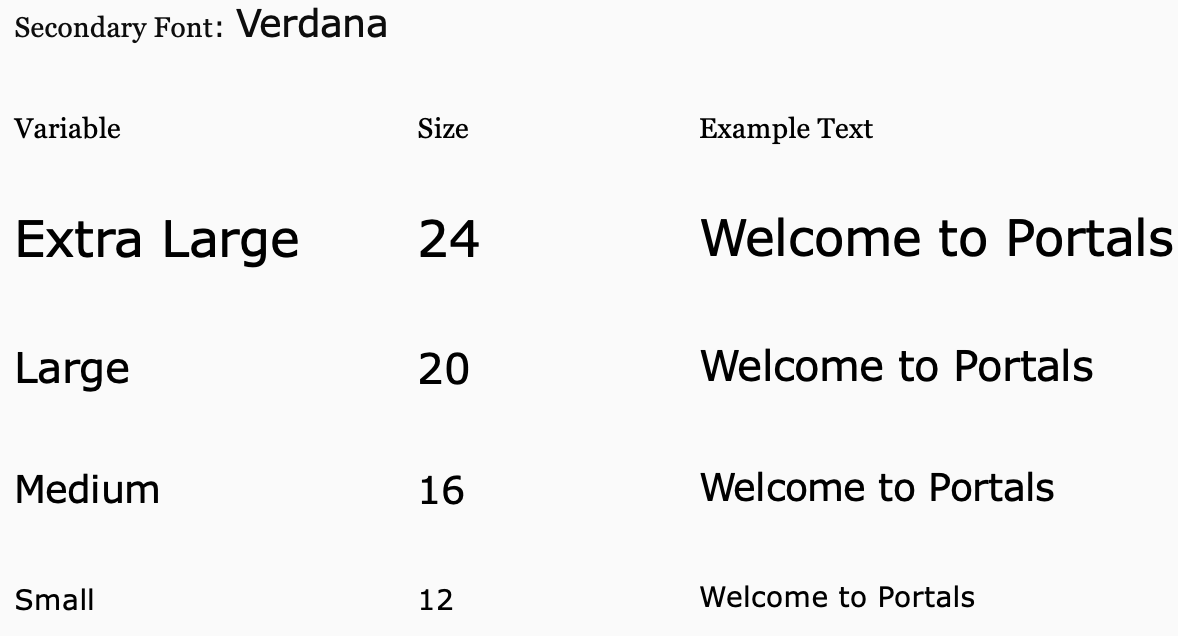

Typography is more than just choosing a font. It’s about ensuring that the text is legible, engaging, and conveys the intended mood or feeling. For this project, I chose a primary font for headings and captions as well as a complementary secondary font for body and other text.
Color
Colors play a pivotal role in user engagement and attention. The palette for this project was aligned with the branding of adjacent tools and selected to enhance user experience. The Primary color palette was used for the interface whereas the secondary color palette was used for actions such as OnHover, OnSelect, etc.


User Flows
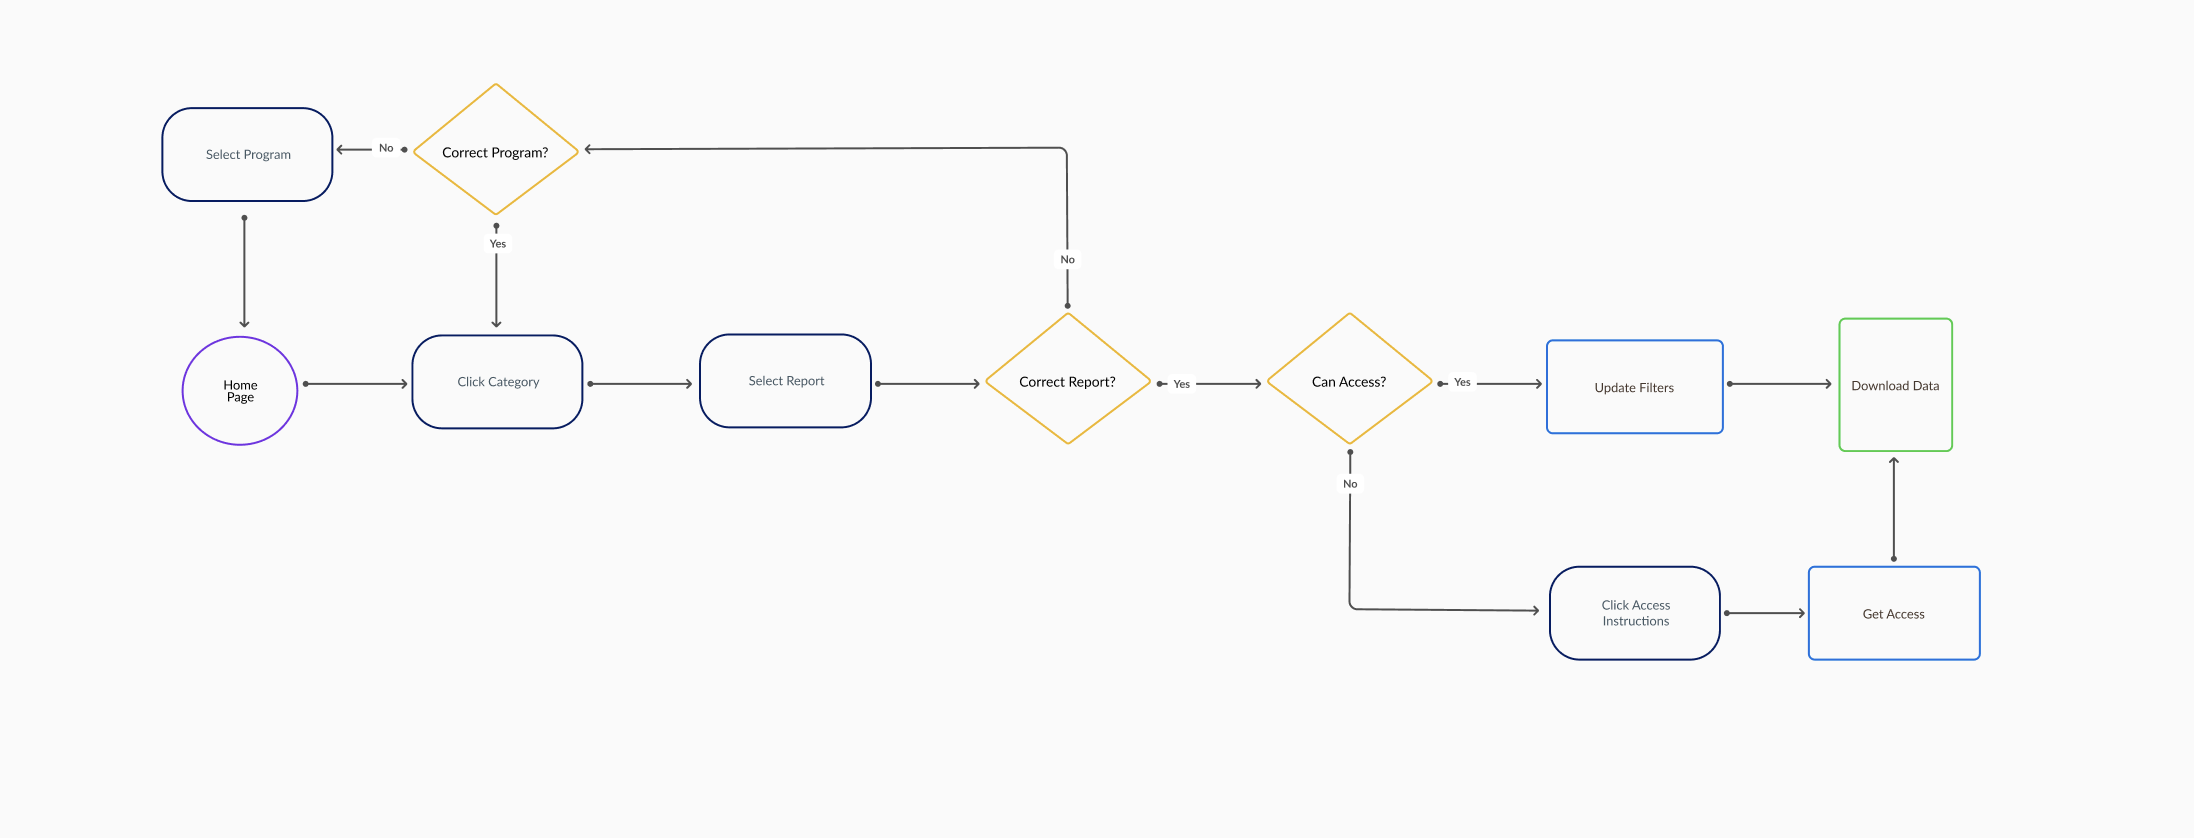
After identifying the pain points, I decided to go ahead and list solutions that the product should have. These were eventually consolidated as design requirements and the objectives to keep in mind while going through the design process.
Wireframes
After having a list of solutions and ideal user flows worked out, the next step was coming up with prototypes that fulfilled requirements and worked well. Wireframing was a foundational step in this process. It offered a skeletal structure that guided this product's direction. While the development process witnessed the creation of numerous wireframes, they can be broadly categorized into the three phases.
Wireframe 1
Initial Attempt

Overview: The process started with consolidating all the user requirements in one screen. On paper, this covered everything but there was a lot of progress needed for the product to completely develop.
Key Features:
Initial product solutions
Horizontal and Vertical navigation
Feedback: Presence of both navigation styles made it confusing for users to know where they need to click to reach their desired site.
Wireframe 2
Increased Clarity and UI/UX Enhancements
Overview: This stage was focused on user interaction. The goal here was to try and reduce clutter by offering only one navigation experience at a time.
Key Features:
Expandable navigation to reduce noise
Single focus screen to select between report options
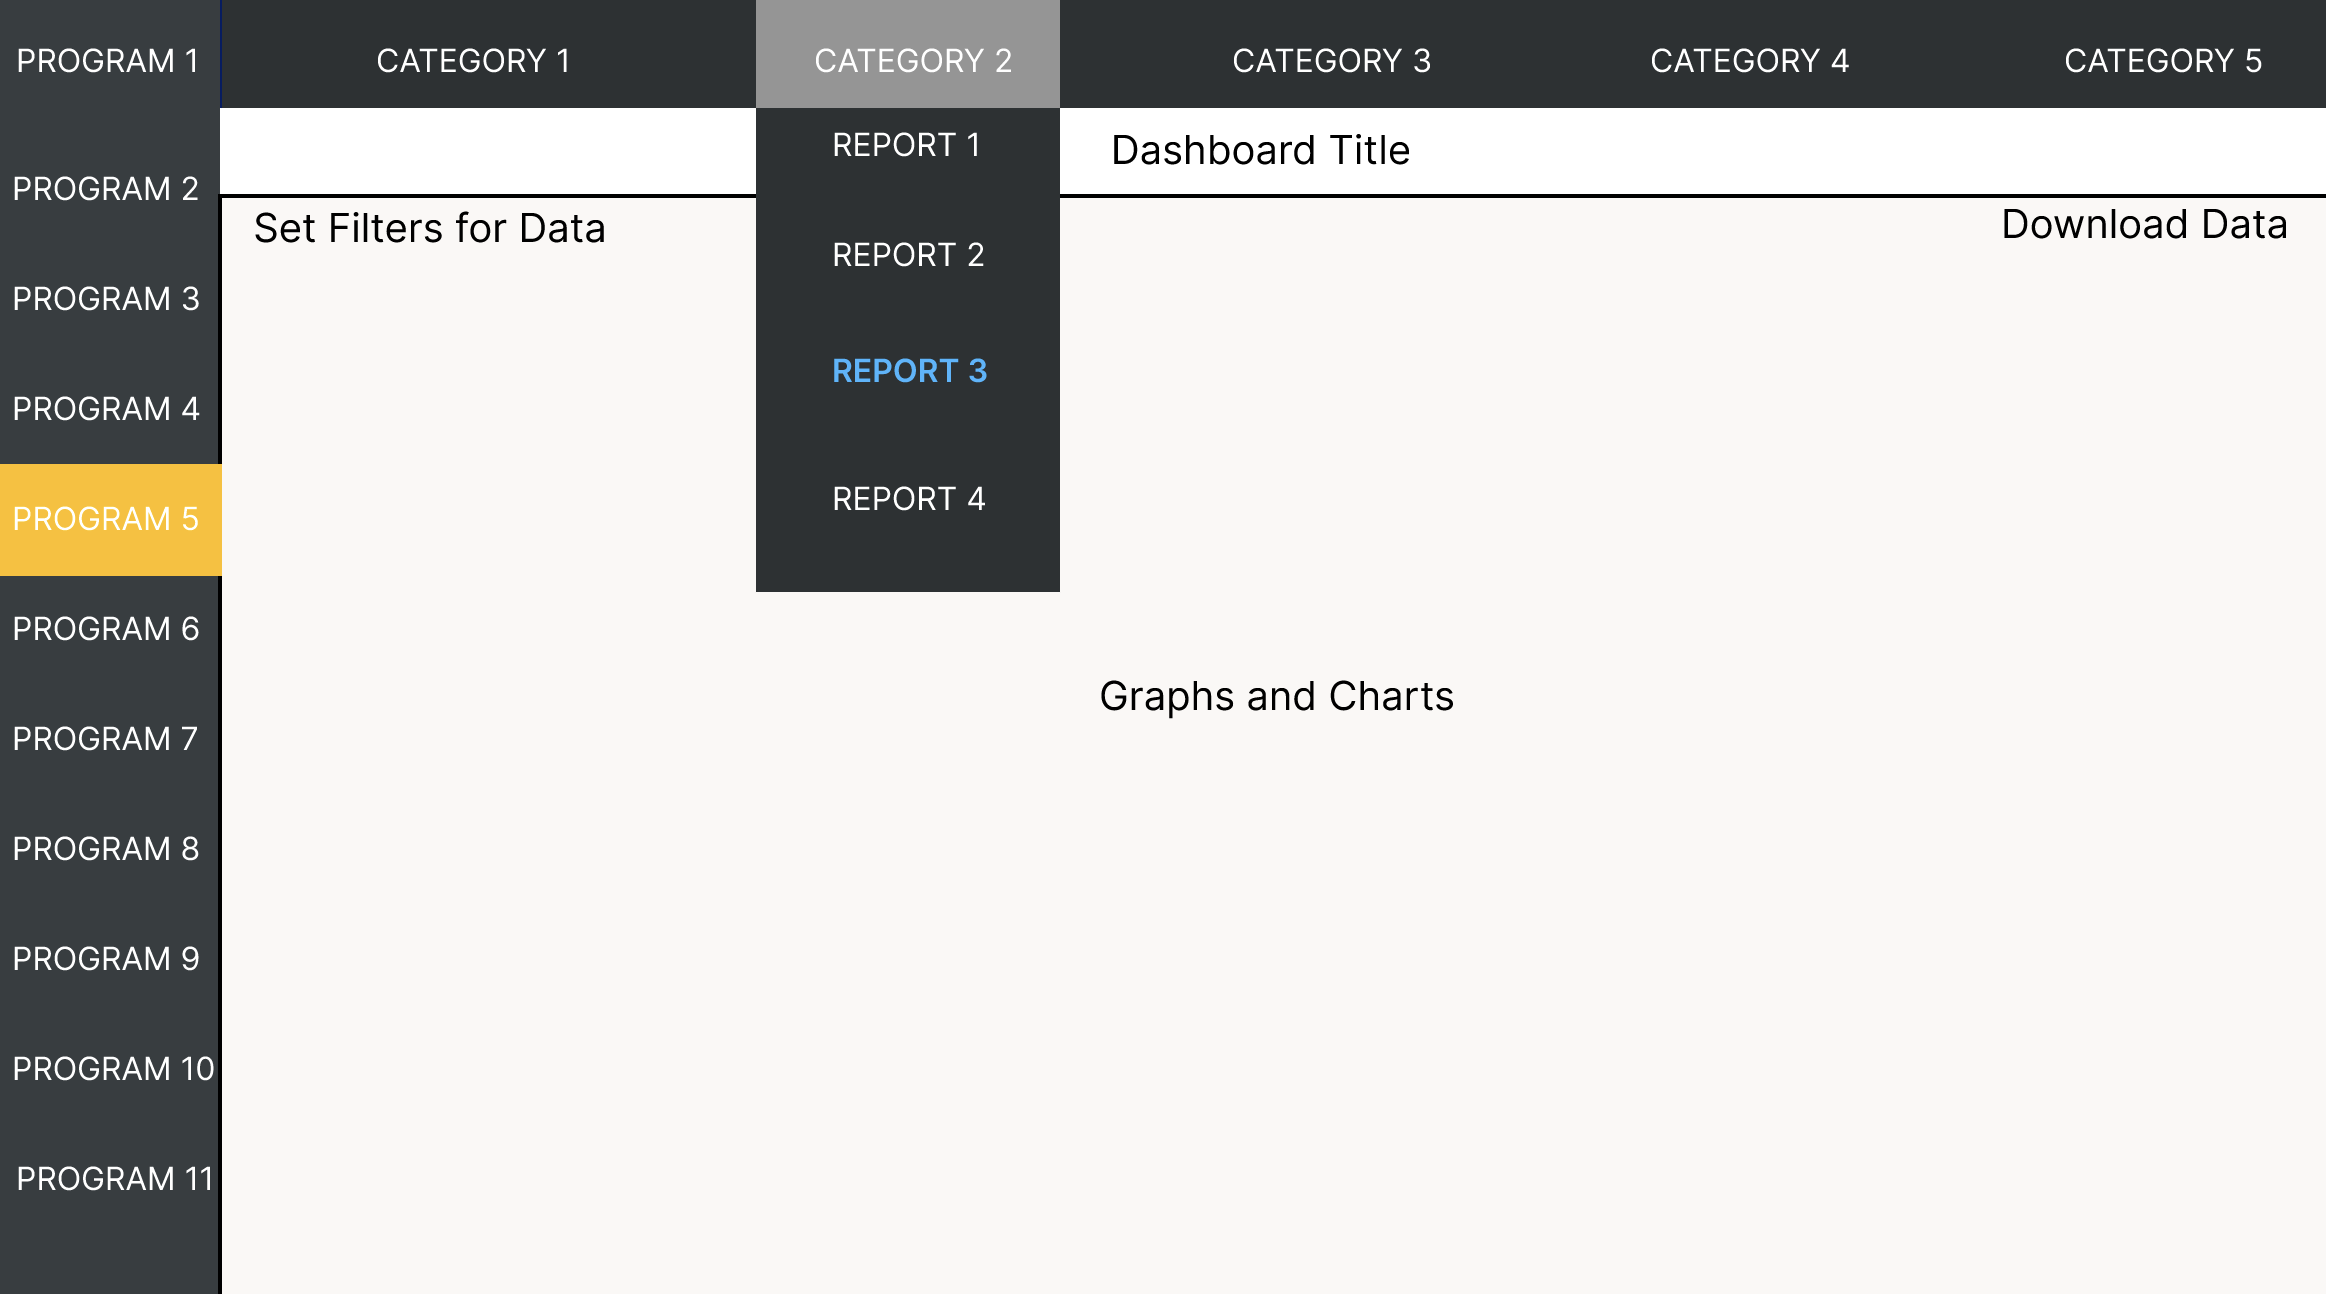
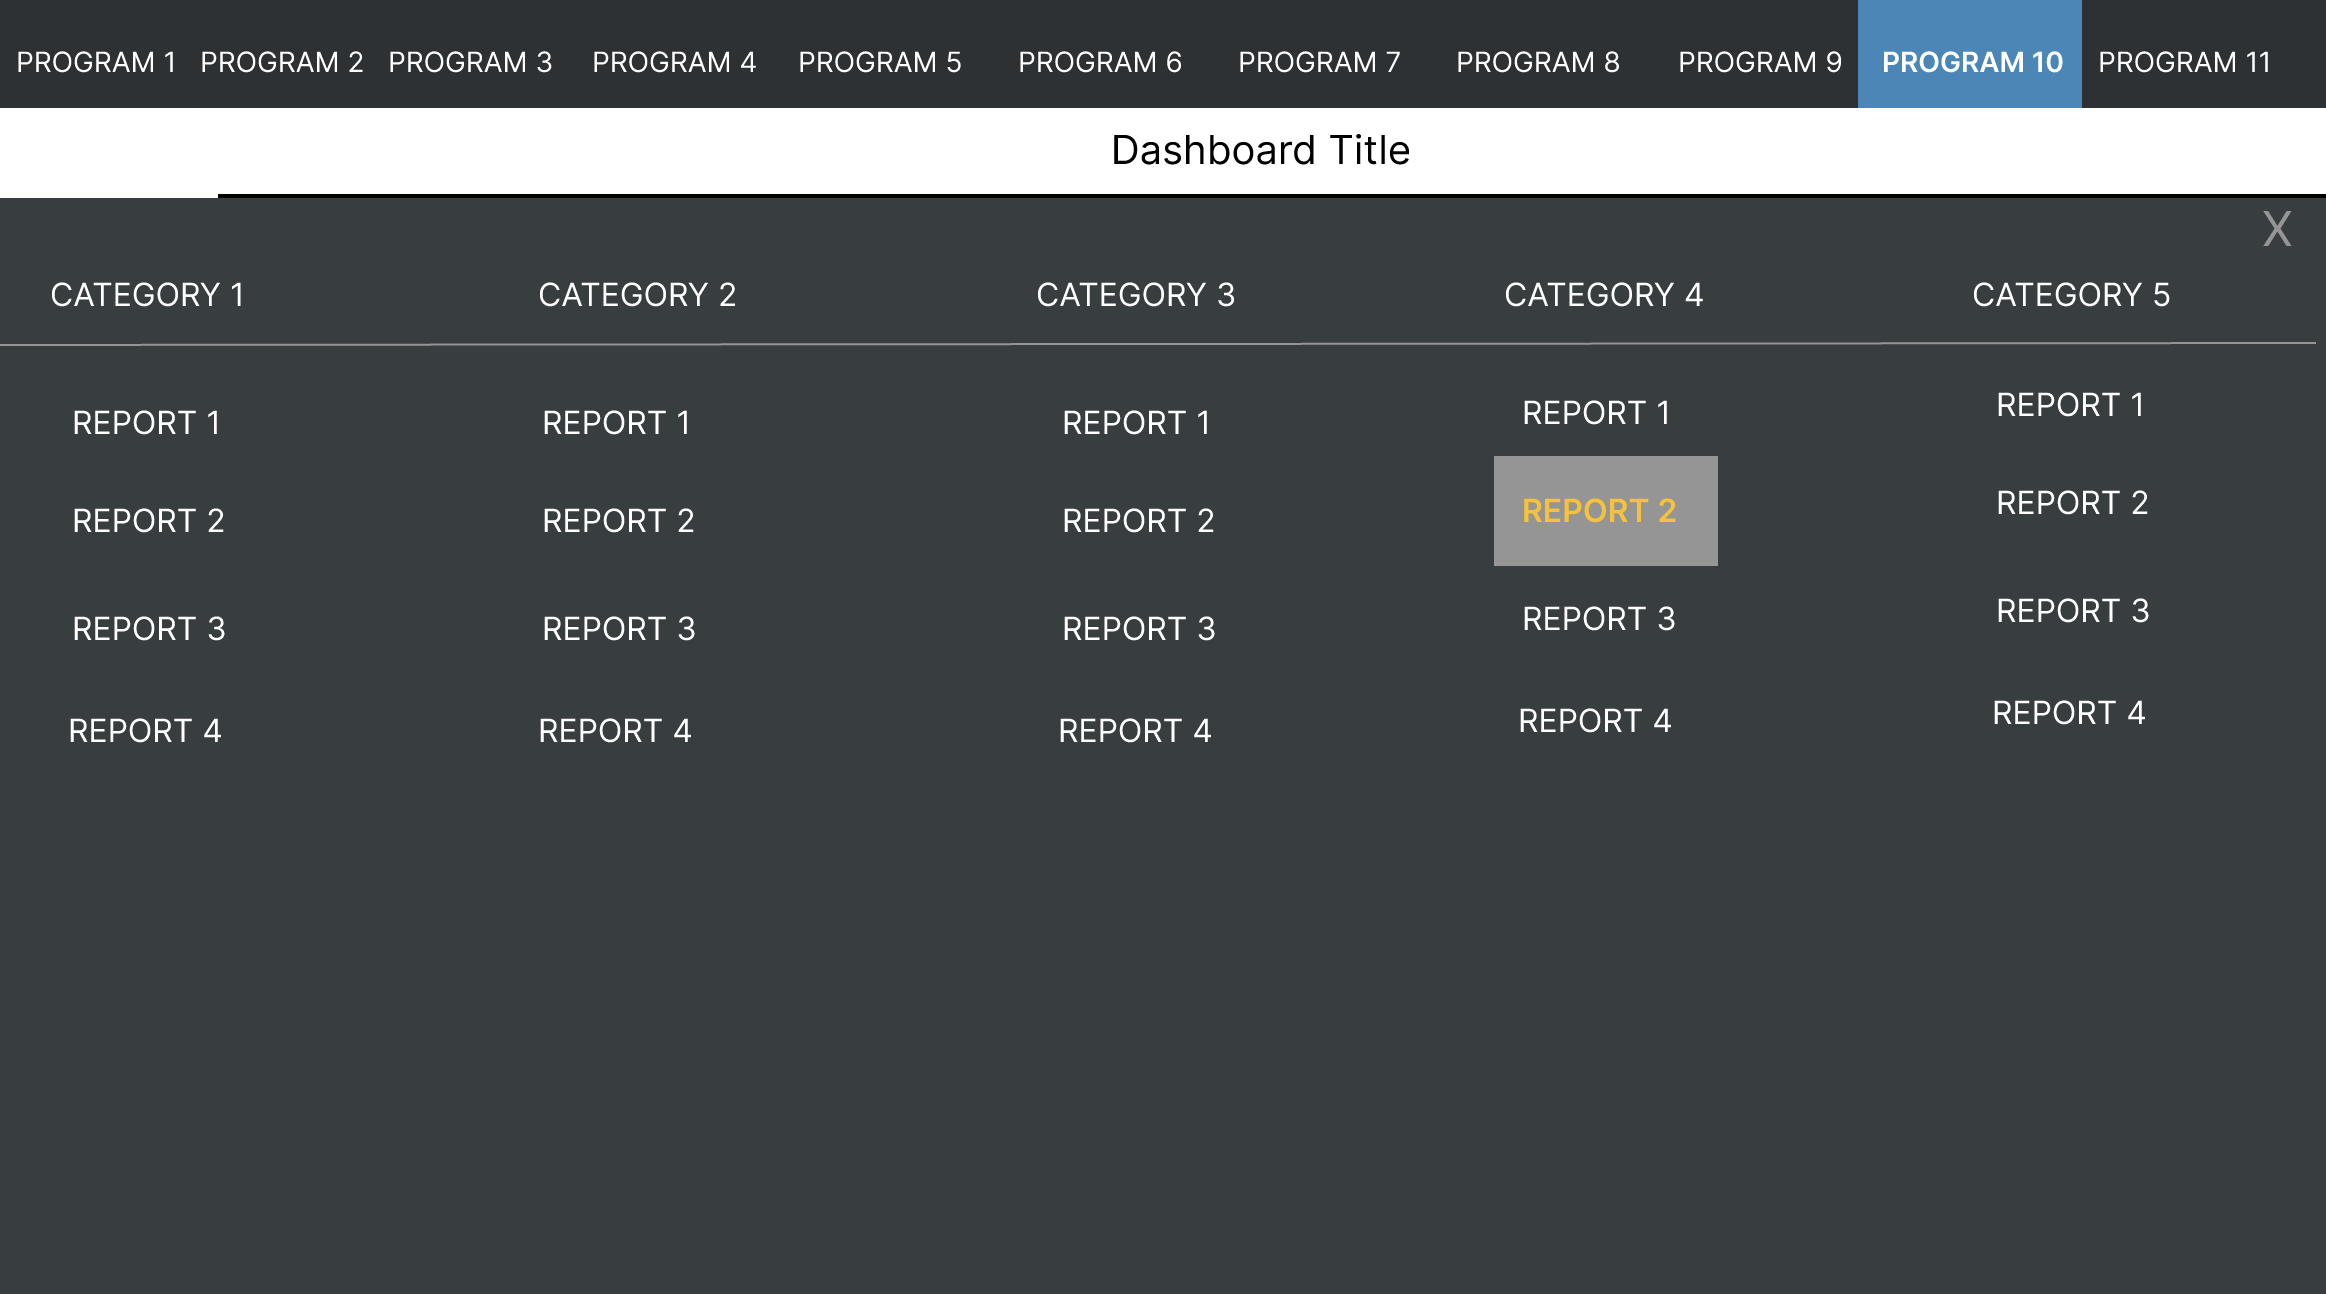
Feedback: This was an improvement on the previous one and the expandable navigation was met with approval. However, keeping 11 programs on the top made that area look really cramped.
Wireframe 3
Simple and Consistent

Overview: This was the last stage of wireframing. Here, the focus was on making the simplest possible tool with minimal scope for confusion
Key Features:
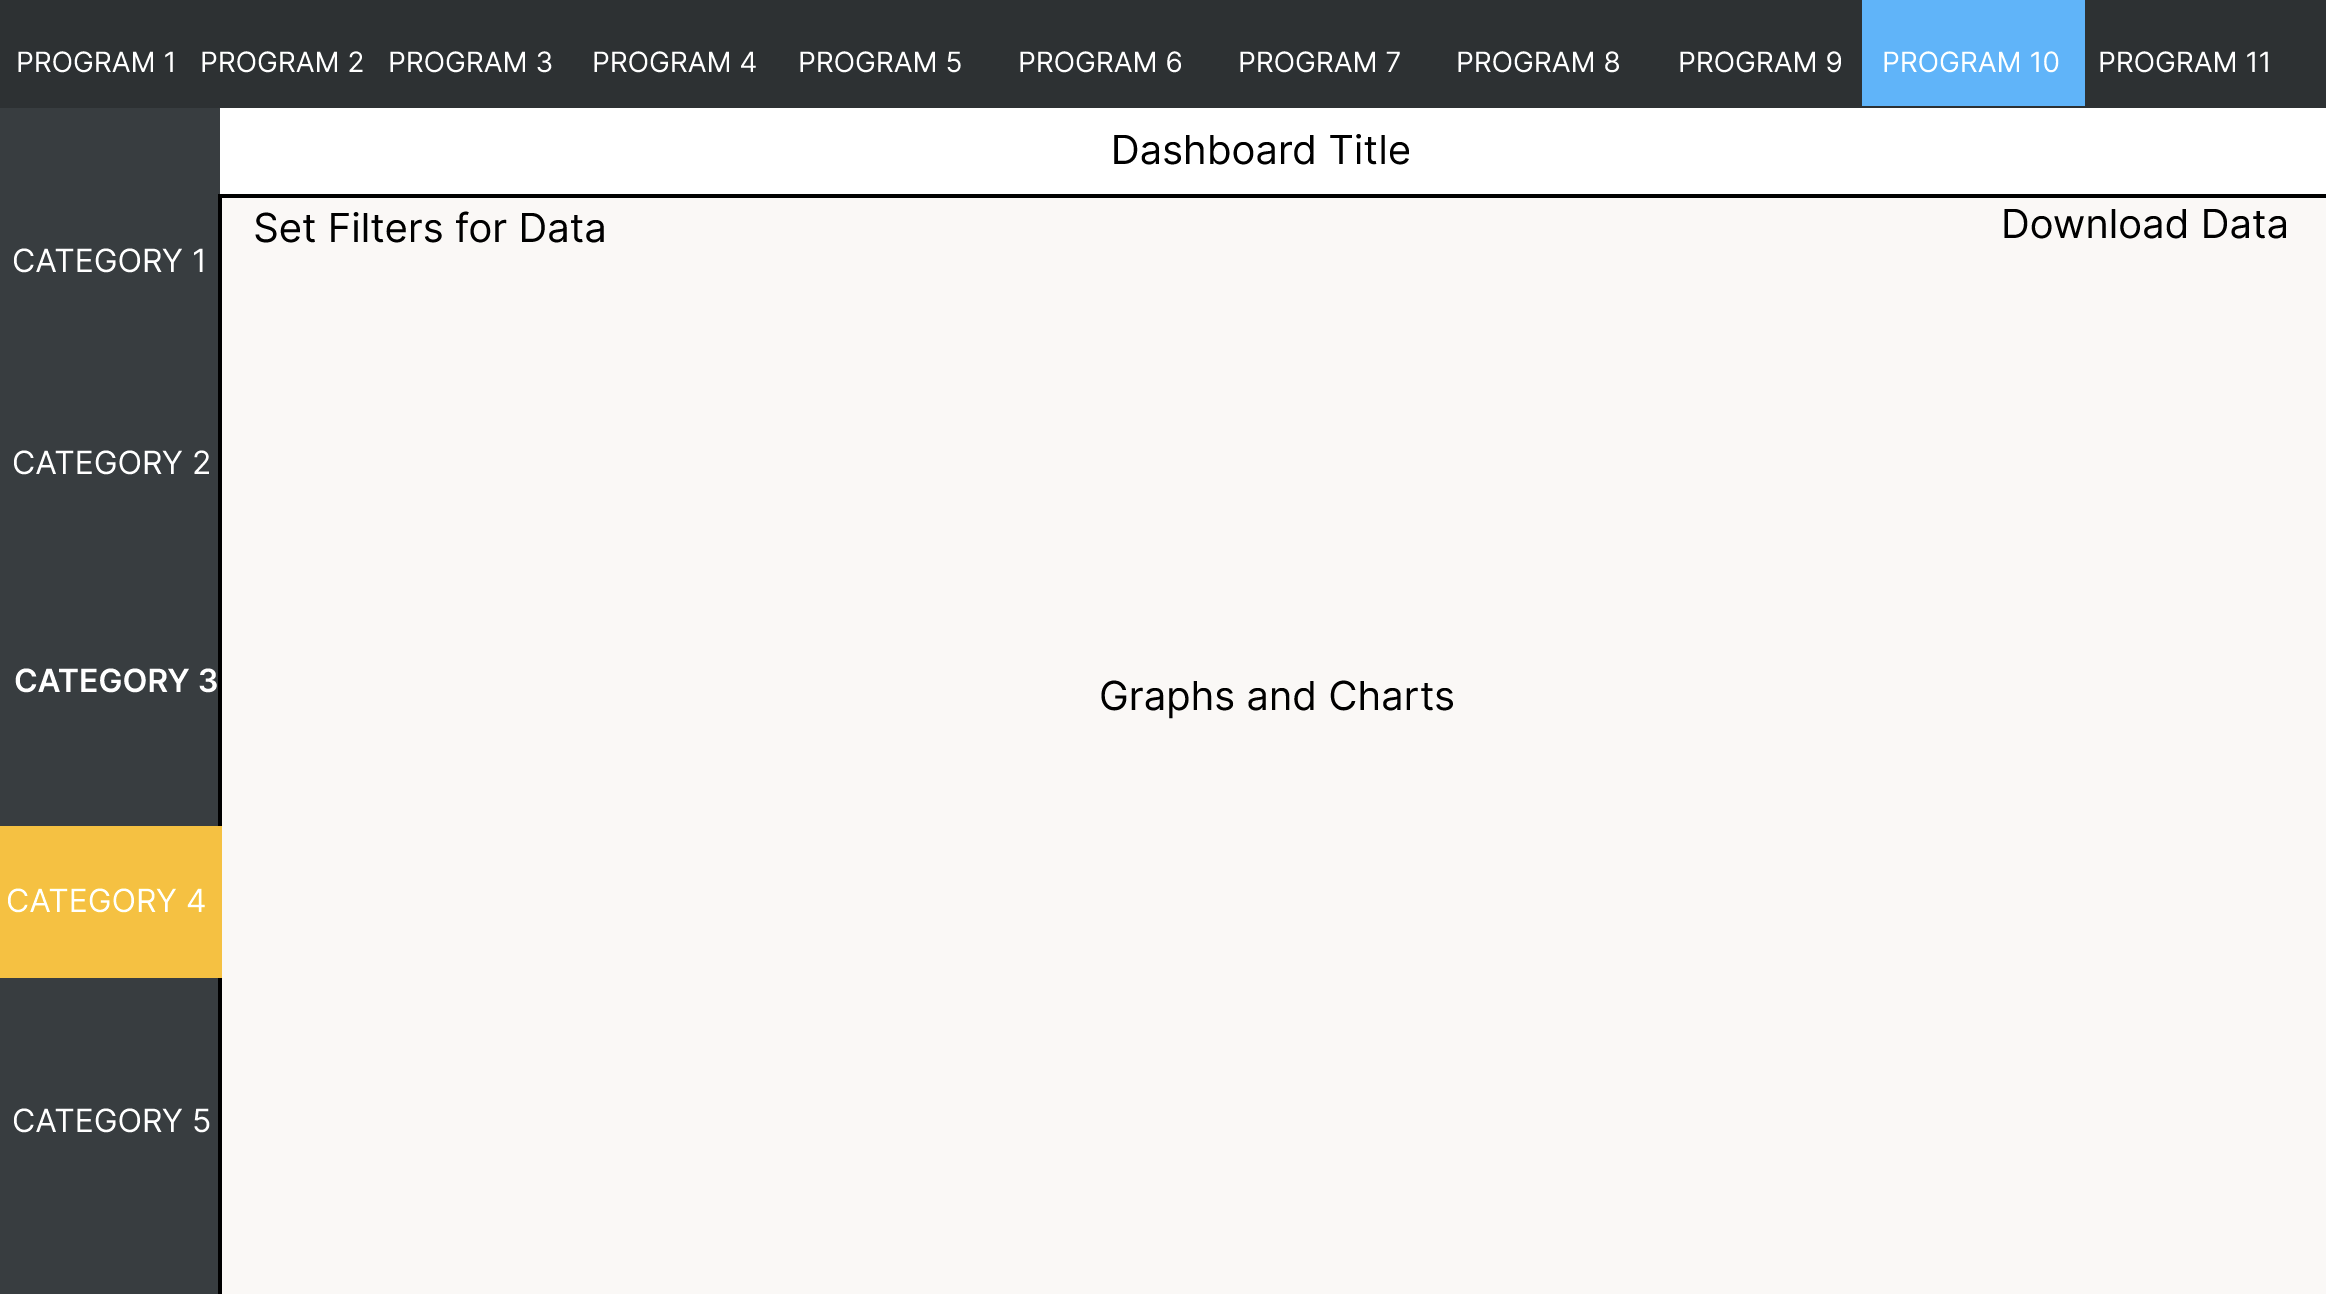
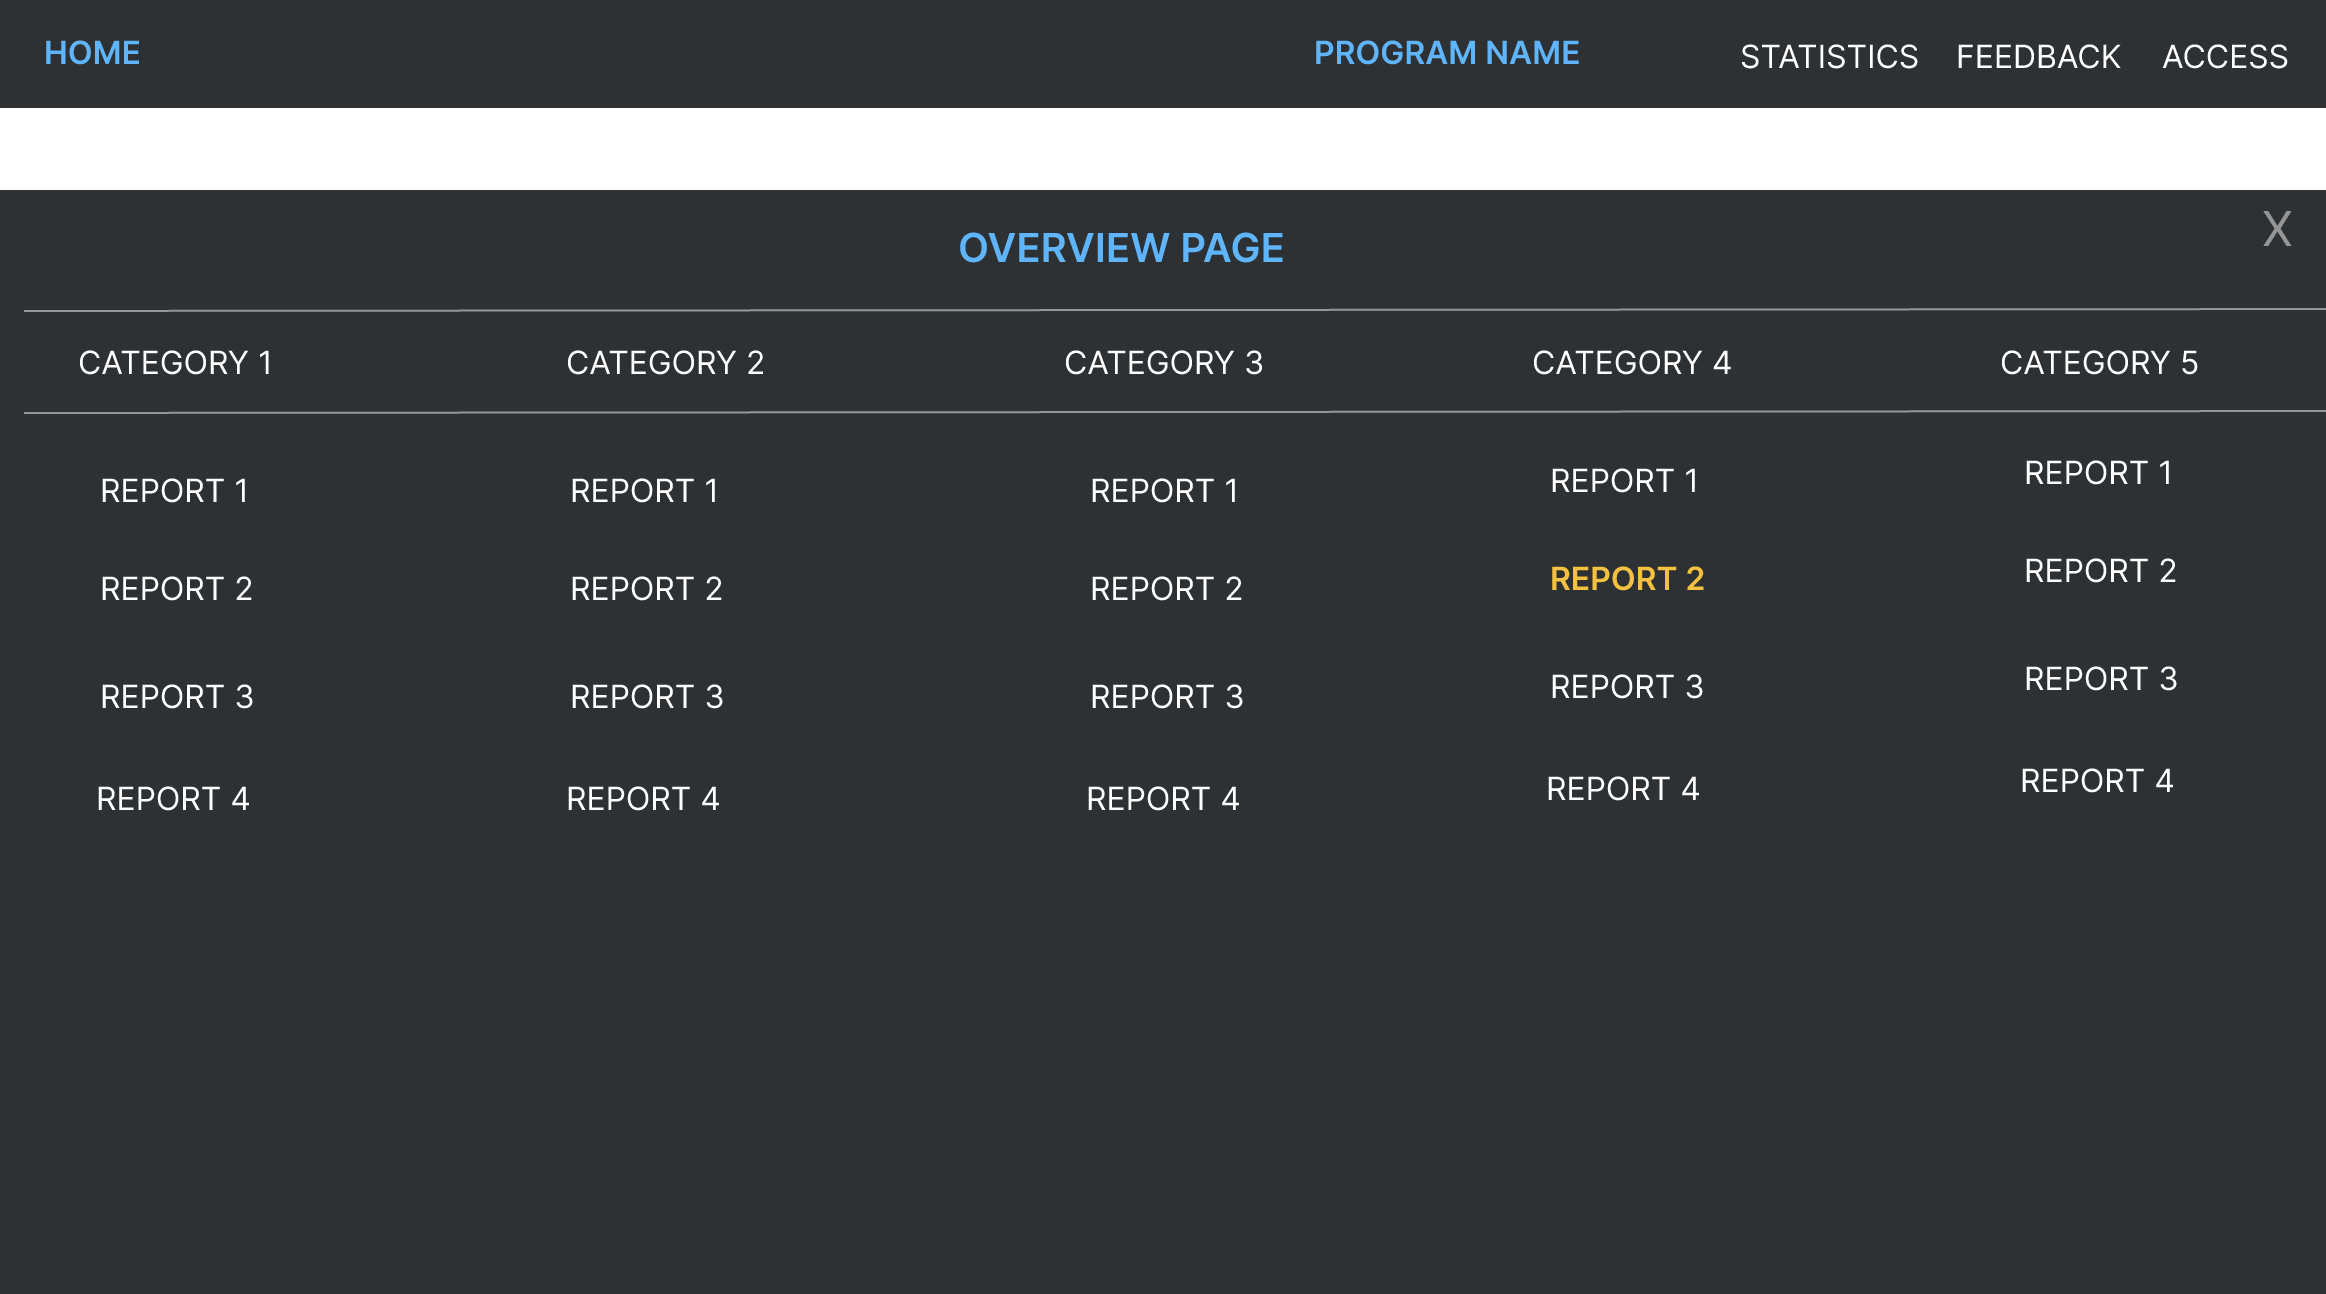
Programs consolidated onto a separate page accessibly by one click
Access and Feedback buttons available at all time on toolbar to guide users
Feedback: This version was liked by users and it was considered to be a minimalistic solution that fulfilled requirements and was accessible.
Delivery
Socialization
Fundamental to the adoption of this tool was a comprehensive and inclusive socialization strategy. Constant email updates during development kept stakeholders in the loop, while a slide deck acted as an accessible reference. I also created an instructional video to simplify the onboarding process and actively encouraged team-wide sharing to maximize reach and understanding. This strategic approach ensured a smoother transition for all users, fostering quick adaptation to the new system.
Engaging Communication: Regular email updates were dispatched during the development process. These weren’t mere status updates but crafted with an aim to keep the community informed, excited, and to foster a sense of collective progress.
Collaborative Feedback Loop: Encouraging team members and users to share the link within their teams not only expanded its reach but also opened avenues for a richer feedback mechanism. This iterative feedback loop became instrumental in refining the system further, ensuring it was aligned with real-world use cases.
Visual Guides: Recognizing the varying degrees of tech proficiency across our user base, an instructional video was produced. It served as a user-friendly guide, detailing functionalities, showcasing features, and simplifying the onboarding process.
Comprehensive Deck: A detailed presentation deck was created, highlighting the key features, benefits, and instructions for the navigation system. This resource was invaluable, serving both as an introduction for newcomers and a reference point for established users.
Tracking Metrics
To gauge the efficacy of the new navigation system, a robust metrics tracking framework was integrated. By monitoring daily and weekly active users, as well as overall views, we could discern usage patterns and identify potential areas of improvement. We also kept an eye on user behaviors, like the frequency of landing page use for program transitions, and differentiated views by portal type. This data-driven approach provided invaluable insights, ensuring the system continually evolved to meet user needs and expectations.
User Engagement: Daily and weekly metrics painted a picture of the platform’s engagement levels, with Daily Active Unique Users and Weekly Active Unique Users being the primary indicators.
Content Popularity: By tracking the total number of views per day and week, it was possible to gauge the popularity of content, understanding which reports and features drew the most attention.
Navigation Patterns: Monitoring the number of users utilizing the landing page to transition to other programs provided insights into user navigation patterns and preferences.
Audience Distribution: The breakdown of viewers by portal type offered a clearer understanding of the distribution and preferences of our audience, allowing for targeted improvements and customizations in subsequent iterations.
Final Product
Portals
The end result of this entire process was a portal system offering seamless navigation across numerous programs, ensuring that users, regardless of their department or tech proficiency, could access the data they needed. As you scroll further, you'll witness a snapshot of the final product. Please be aware that while the UI/UX showcased is representative of the actual product, certain aspects and data points have been modified for confidentiality reasons. Should you have any queries about the design journey or anything else, please don’t hesitate to reach out.


